Flare Monitor (BETA)
How does flare monitor work?
Our agent program "SPIDER" connects to the SDO website every ten minutes to search for the new HMI images and download them to our server.
These images are then processed by "ASAP" to automatically detect, group and then classify the sunspot groups and calculate their flaring probabilities.
How can I read the results from the image?
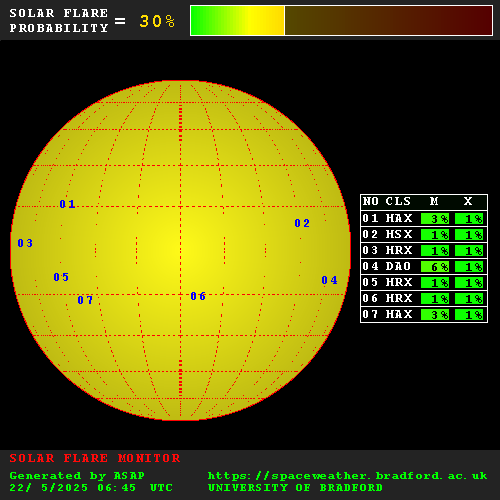
General solar flare probability is given on colour coded bar. This is the general probability for occurance of a C-,M-, or X- class flare.
The detected sunspot groups are numbered on the solar disk.
The classifications and flaring (M and X class) probabilities for these groups are generated and shown on the table.